Debugging
If you're new to Relay, we provide some basic debugging strategies that should serve to help you clarify key concepts as you build your app. Alternatively, Relay provides a couple of tools to inspect the store and its records.
Strategies
Given: You've properly setup your schema on the backend and React on the frontend. You've read through the documents but can't seem to identify what's wrong with your code. You've even done a number of searches but can't find the answer you're looking for.
A few questions to ask yourself:
- Is my compilation up-to-date?
- Is my query valid? You can test this on your GraphiQL endpoint.
If so:
- Put your entire query at the top-level (your
QueryRenderer) and comment out all fragment containers. Pass the data through your component hierarchy down to the components that were using fragments. - If your app isn't rendering properly, use
console.log(props);for every component to see the props you are actually passing. - Once your app is rendering, uncomment the deepest fragment container and add that fragment back to your top-level query. Everything should still render. If not, use
console.log(props);again. - Continue uncommenting fragments and confirming that your app renders until your top-level query is as desired.
- If this still fails, come back to your code later and try debugging with a fresh mind. Additionally, you can post an issue and someone should get back to you hopefully within a few days.
Tools
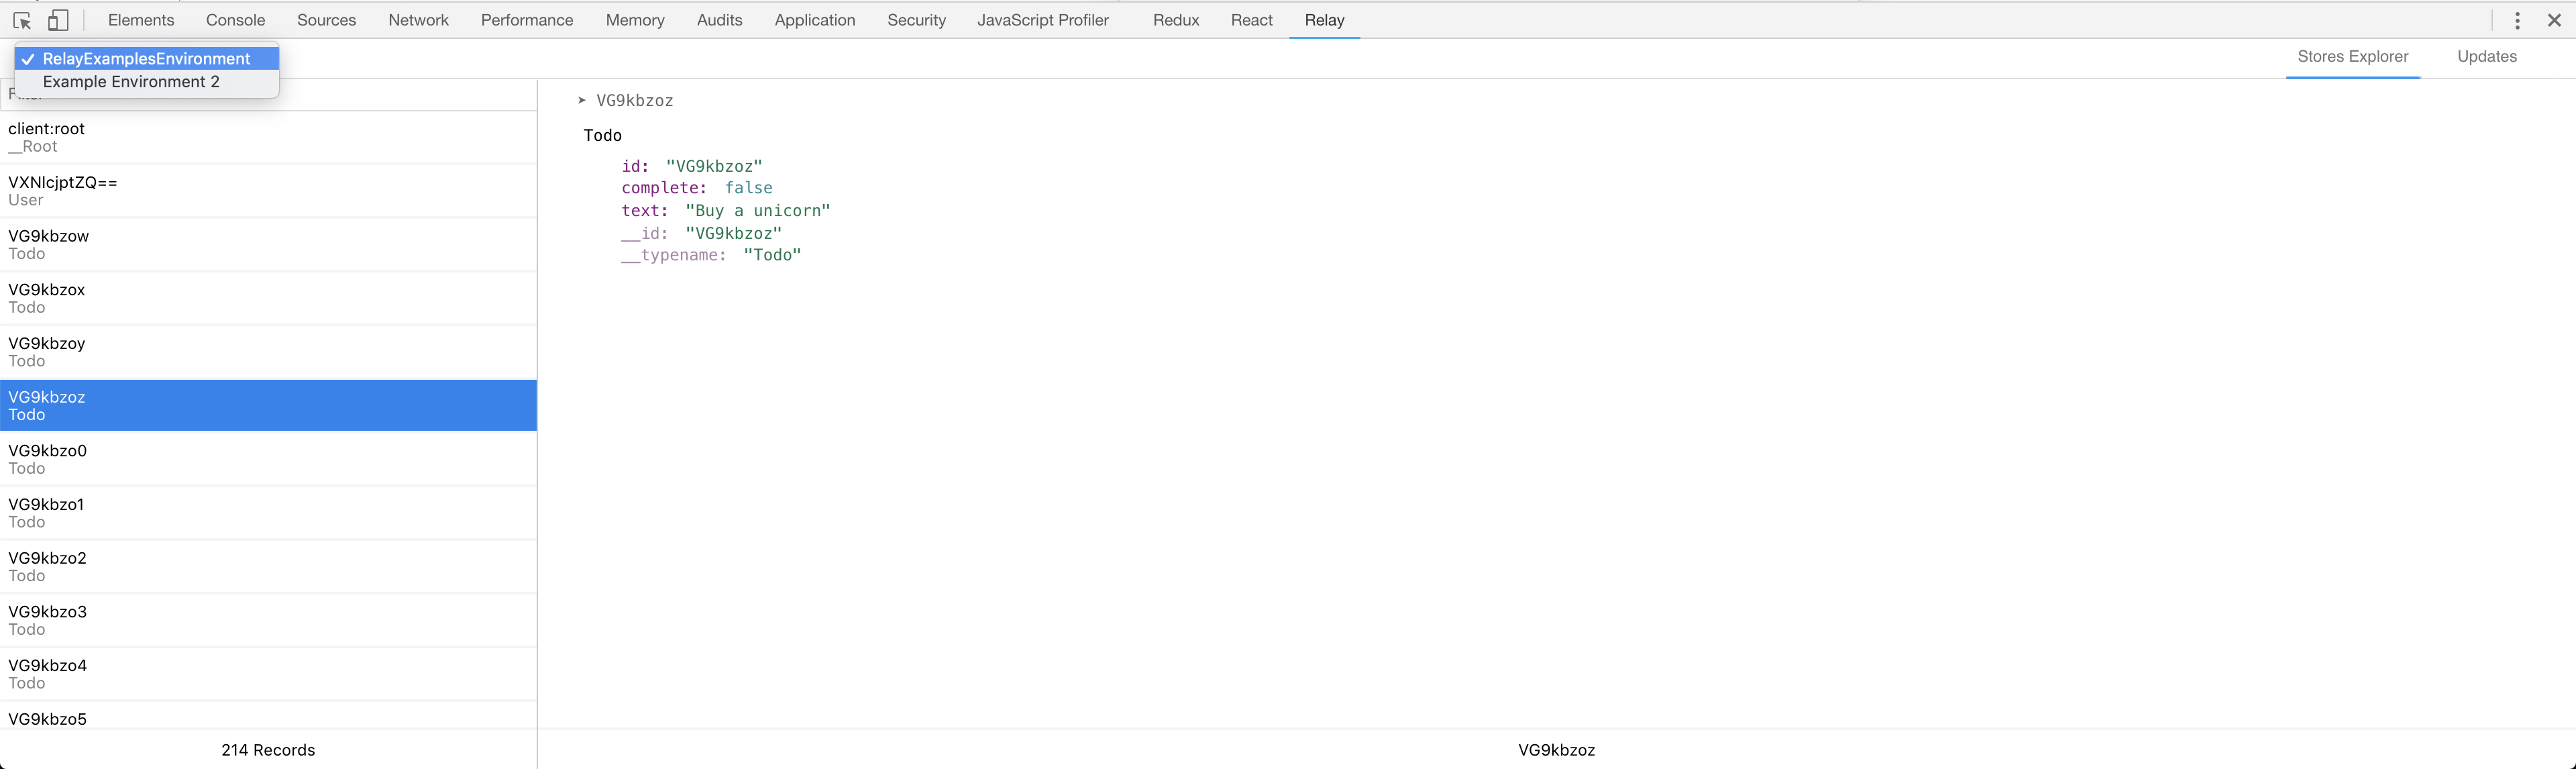
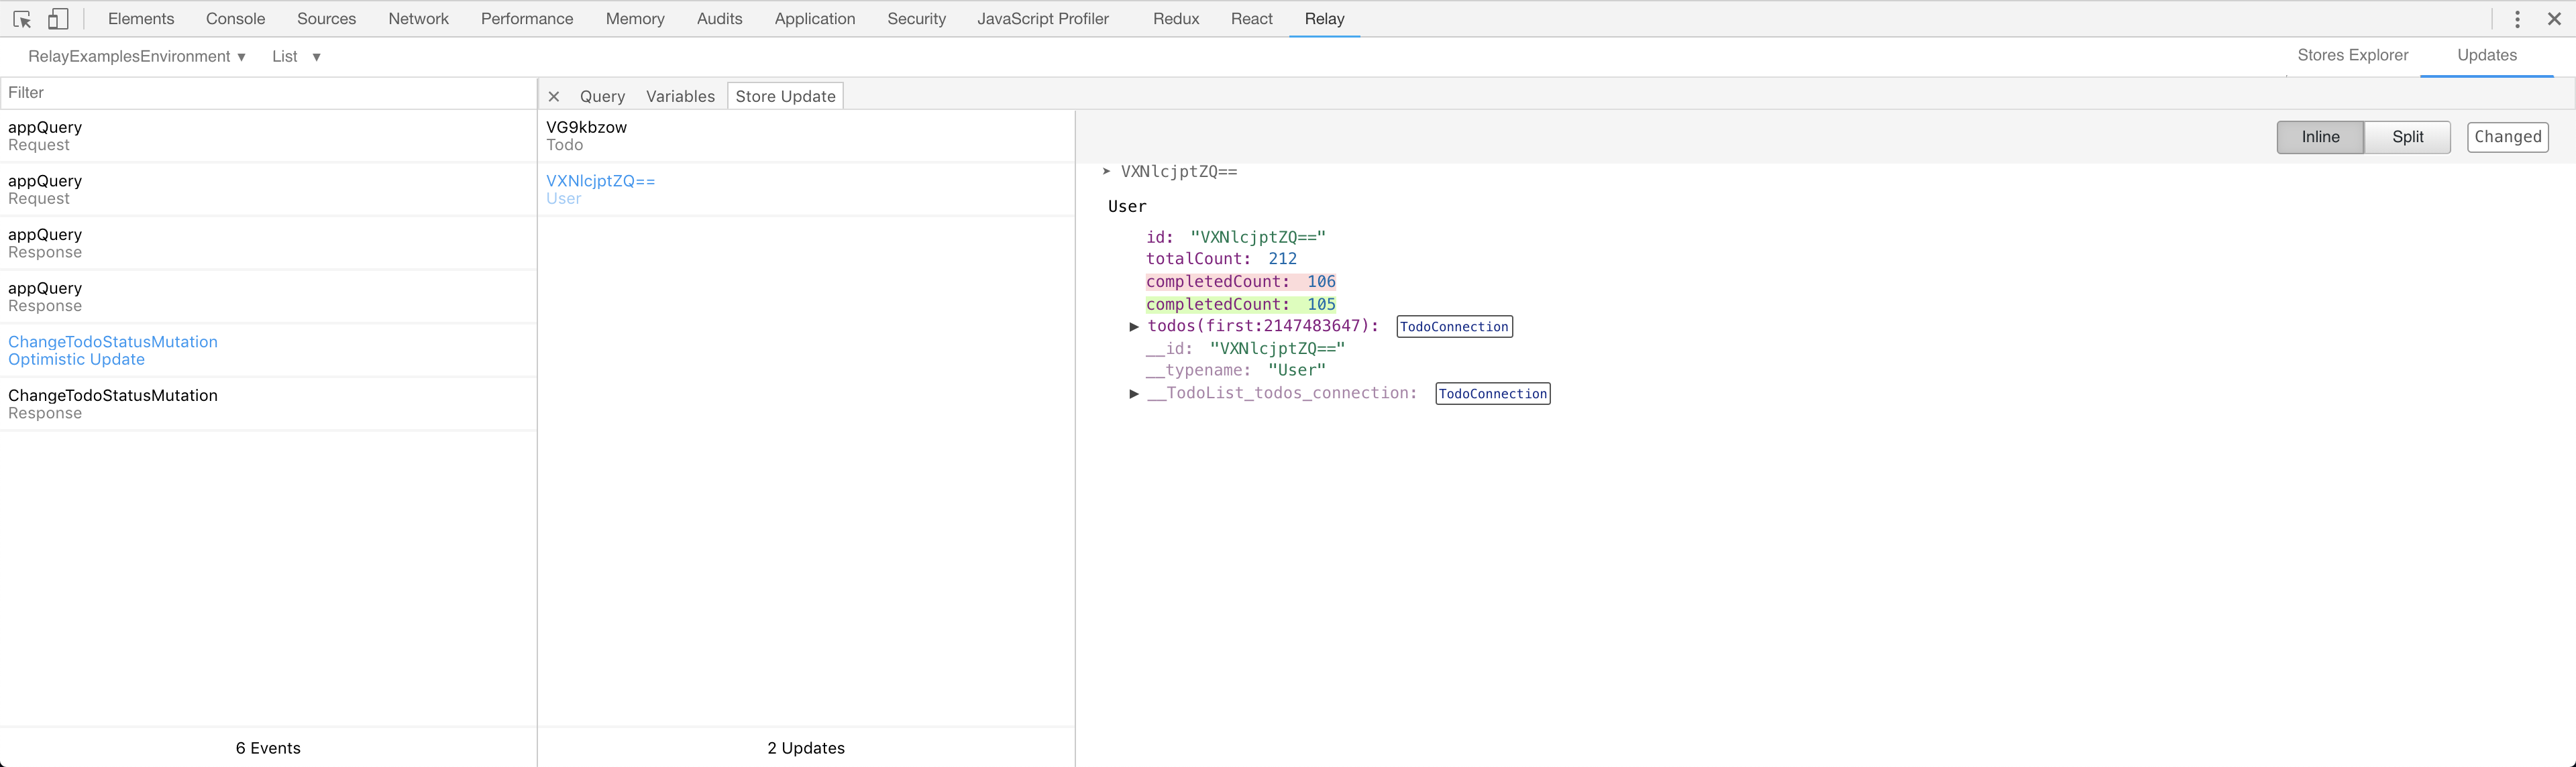
Relay DevTools is tool designed to help developers inspect their Relay state and understand how store changes overtime. Relay DevTools ships in two ways:
- Chrome Extension creates a Relay tab in the developer tools interface for debugging apps in Chrome